Did you know that you can build your own toolbelt-widgets in iTerm2?
What’s iterm2 anyway? It’s one of the most powerful if not the most powerful terminal emulator for macOS. It’s neither bloated, it’s free, it feature-rich and I am a huge fan of it.
However, there is this cool feature called “Toolbelt”: A sidebar with a colection of small productivity tools… notes, code snippets, history… but one thing is missing. something most admins and sysop-dudes and dudesses probably need occasionally or regularly: a system monitor widget.
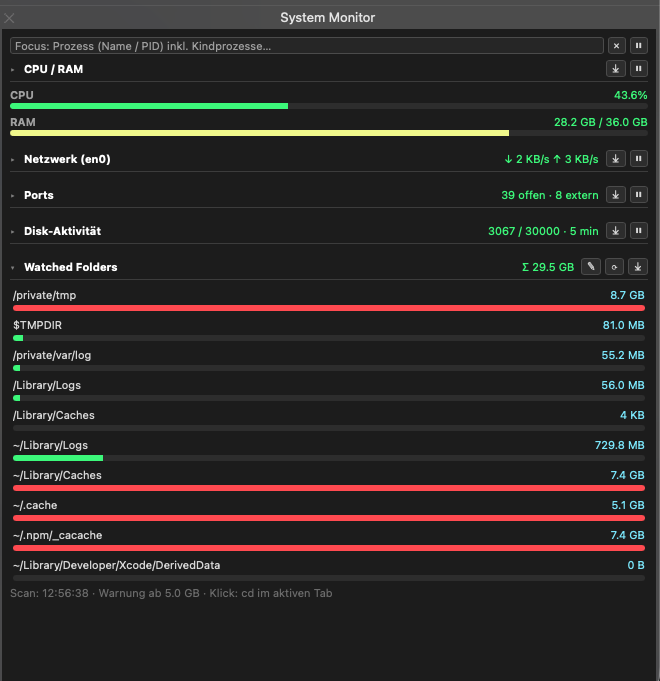
And iTerm2 supports custom widgets using Python! So I built my own system monitor widget for the toolbelt and it has a lot to offer:
- CPU and memory usage, splitted into CPU usage per kernel and memmory usage splitted into usage per type (used, swap, cached, free)
- of course a list of running apps, processes and services
- of course a network usage overview showing processes’s up- and download, including per-process request details
- of course a list of open ports and the services listening on them
- of course a disk activity monitor showing what files are being touched, modified, created and so on
- a watch list for folders and their sizes - to keep track of where your disk storage is being used, allowing you to clean up cache, temp or folders easily
There is a lot of interactivity. You can click process to see further details or “focus” on a specific process to see only this processs network activity, disk usage and cpu utilisation.
It’s open source: https://github.com/nickyreinert/iTermSysMon
And installation is quite easy: Put the Python-file into this folder:
~/Library/Application Support/iTerm2/Scripts/AutoLaunch/
(Create if not existing)
Restart your app or do CMD+OPTION+J to open iTerm2’s “script monitor” where you can reload custom scripts (and watch their output).