Table of Contents
Yeah, I know, there are many many confidence calculators out there. But this one is different, because it’s mine ‘(͡• ͜ʖ ͡•)’
No seriously. All the other options out there are either a little too complicated, lacking features or missing simple layman explanations - because: I am not a data scientist, a market researcher or a rocket scientist. I’m just…a dude, I guess.
However: I built this one as an Excel file, because I was working with Adobe Target for a huge… very huge… very infamous - I mean - famous of course - German railway company. And later improved it to look even nicer. And then I got the hint: Make it a product. Yeah well, here it is. It’s free. Thank me later. (⌐■_■)
Here it is:
- you can easily add up to 5 variants
- you can easily configure confidence levels or other parameters and they are explained in a simple but hopefully sufficient way - I will also repeat it here - for your convenience
- you can share the results - always, everywhere, because the parameters are hidden in almost plain sight in the URL
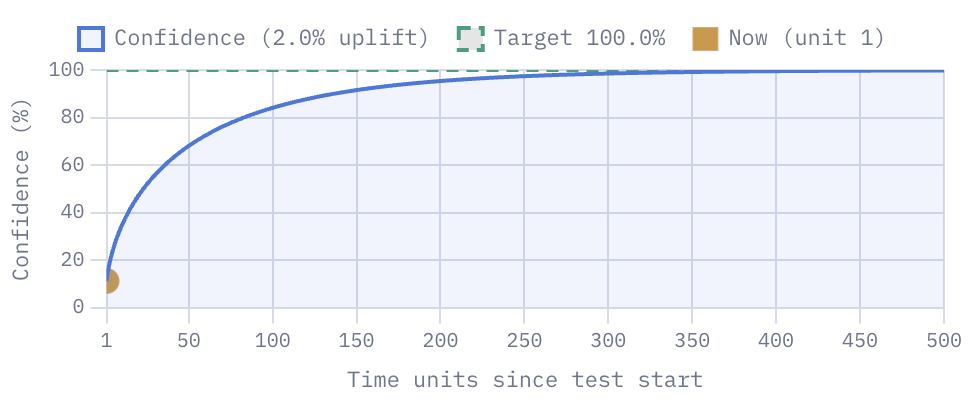
- you can see two charts showing you, when the test will reach a certain confidence level, like how many days you have to wait
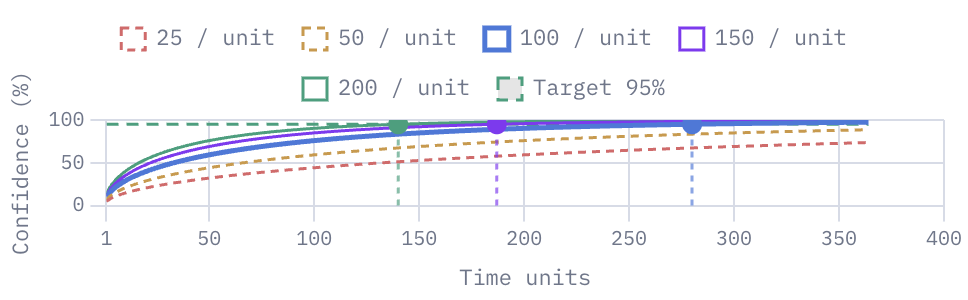
- or how different traffic numbers will affect the confidence level
Dont hack the P!
Well, now you might think: I have an interface. I will just update it everyday and as soon as I reach the required confidence level, the test is succesful.
That’s called p-hacking. Don’t do that. What if the very next day, the numbers are going down again, because this one special day external and unknown factors influenced the test?
That’s why you plan a test and define a target* to reach - not only the confidence level, but also the running time and the number of visitors.
Some basic information about A/B testing
The hypothesis
This is where everything starts: Your assumption. This is mostly a bookkeeping task and does not affect the calculation itself.
The null hypothesis says: “The test will have no effect on the conversion rate.” Your goal is to disprove it.
The alternative hypothesis says: “The test will have an effect on the conversion rate.” Your goal is to find enough evidence to reject the null hypothesis in its favour.
Type-I and Type-II errors
The Type-I error means the result is a false positive: The test suggests an effect exists — while in reality, no effect exists. You want to avoid that, too.
The Type-II error means the result is a false negative: The test fails to detect an effect — while in reality, a real effect exists. You want to avoid that, apparently.
Test Type
It sounds strange, but it’s easy: A test can have two effects: A conversion rate can either increase or decrease.
A one-sided or one-tailed test assumes that only one direction is possible. A two-sided or two-tailed test assumes that both directions are possible. A one-tailed test requires less data and reaches confidence faster, but there is a risk: What if the effect is in the other direction? You won’t see it because it’s not part of the calculation. You want to see the calculation?
$$ p_{\text{one-tailed}} = 1 - \Phi(z) \qquad\qquad p_{\text{two-tailed}} = 2,\bigl(1 - \Phi(|z|)\bigr) $$
What’s the confidence level?
There are many mathematical and very complex ways to explain that, but actually, what I think is important to know, is this:
You want to make sure that the results of your A/B test are not just coincidence or luck. The p-value estimates how compatible your observed data is with the assumption that there is no real effect — in other words, how likely it is that what you see is just noise.
Before running a test, you typically choose a significance level — for example 5%, corresponding to a 95% confidence threshold. In this calculator, confidence is reported as:
$$ \text{Confidence} = 1 - \text{p-value} $$
Strictly speaking, confidence levels and p-values are distinct statistical concepts. But this representation is commonly used in A/B testing tools because it is intuitive for non-specialists — and it is what your calculator reports.
The higher the confidence level, the lower the chance of a Type-I error.
What’s the significance level?
In simple words: It’s the confidence level but the other way around, like:
$$ \alpha = 1 − \text{Confidence} $$
It’s closely related to the p-value, like: The significance level is the threshold, the p-value is the result.
The lower the significance level, the lower the chance of a Type-I error.
What’s the power of the test?
This is probably the second most important metric of a test and it’s almost the opposite of the confidence level. Confidence tells you how sure you are the effect isn’t noise; power tells you how likely the test is to detect a real effect if one exists.
Assuming there is a real effect, how likely is this test to detect it?
Power is not part of the p-value calculation. Instead, it helps you estimate before the test starts how many visitors are needed to reliably detect an effect.
$$ \text{Power} = 1 - \beta $$
What’s beta?
While $\alpha$ and $\text{Confidence}$ are about the Type-I error, $\beta$ is the probability of a Type-II error. The calculation is a little more complex. It requires not only your test variables but also constants such as the z-score.
The lower the $\beta$, the lower the chance of a Type-II error. The higher the power, the lower the chance of a Type-II error.
Uplift, Visitors, Conversion Rate and Distribution
They are quite simple metrics, as they are just common “performance indicators”. Visitors are the people you reach. Conversion can be quite anything that you want to measure and improve. The conversion rate is the percentage of visitors that convert. And the uplift is, either the expected or observed change in the conversion rate.
The other parameters
There is a complex mathematical pipeline behind the calculation of the confidence level for each variant. It starts with the pooled conversion rate:
$$\bar{p} = \frac{c_1 + c_2}{n_1 + n_2}$$
Where $c_1$ and $c_2$ are the number of conversions for variants 1 and 2, and $n_1$ and $n_2$ are the number of visitors for variants 1 and 2.
From this, the standard error SE is calculated:
$$SE = \sqrt{\bar{p} \cdot (1 - \bar{p}) \cdot \left(\frac{1}{n_1} + \frac{1}{n_2}\right)}$$
Which goes into the calculation of the z-score using $p_1$ and $p_2$, the conversion rates of variants 1 and 2:
$$Z = \frac{p_2 - p_1}{SE}$$
Followed by the calculation of the p-value using the z-score and the cumulative distribution function $\Phi$ (shown here as one-tailed; for a two-tailed test it’s $2(1 - \Phi(|Z|))$):
$$p = 1 - \Phi(Z)$$
The what? The cumulative distribution function $\Phi$! Historically it came from lookup tables — today it’s calculated directly by software. You don’t want to know more. (◔_◔)
The p-value is the first important metric, it must be below the significance level $\alpha$ to reject the null hypothesis.
$$\text{Confidence} = 1 - p$$
Therefore, the reported confidence must exceed your chosen confidence threshold before you reject the null hypothesis.
But What Is the Bonferroni Correction?
If you have multiple variants compared against one control group, you may want to apply the Bonferroni correction. It’s meant to reduce the chance of a Type-I error.
How does it work? You simply divide the significance level $\alpha$ by the number of comparisons $m$. So if you have 3 variants, you would divide $\alpha$ by 3. The adjusted significance level is then used instead of the original one when evaluating each variant’s result — raising the bar for everyone. The idea is: if you test many variants at once, the probability of seeing at least one seemingly significant result purely by chance increases. I mean - there are so many colors!
Summary
A simple and easy-to-use confidence calculator for A/B testing. Calculate confidence levels, p-values, power and more for your A/B tests.
Main Topics: A/B Testing Confidence Calculator Statistics
Difficulty: intermediate
Reading Time: approx. 10 minutes